Visualizing Fast Food Outlet Density
Dec 28, 2022
I recently stumbled on a fascinating post where the number of McDonald’s outlets was used as measure of economic development / urbanization of a given area within Malaysia.
It turns out that the author manually collated all the data himself in an excel sheet, even missing out on a few newer outlets.
This post details how to programatically scrape outlet data for any fast food chain you’d like, and then producing visualisations and analysis based on the data.
KFC
Navigate to the Find-A-KFC page
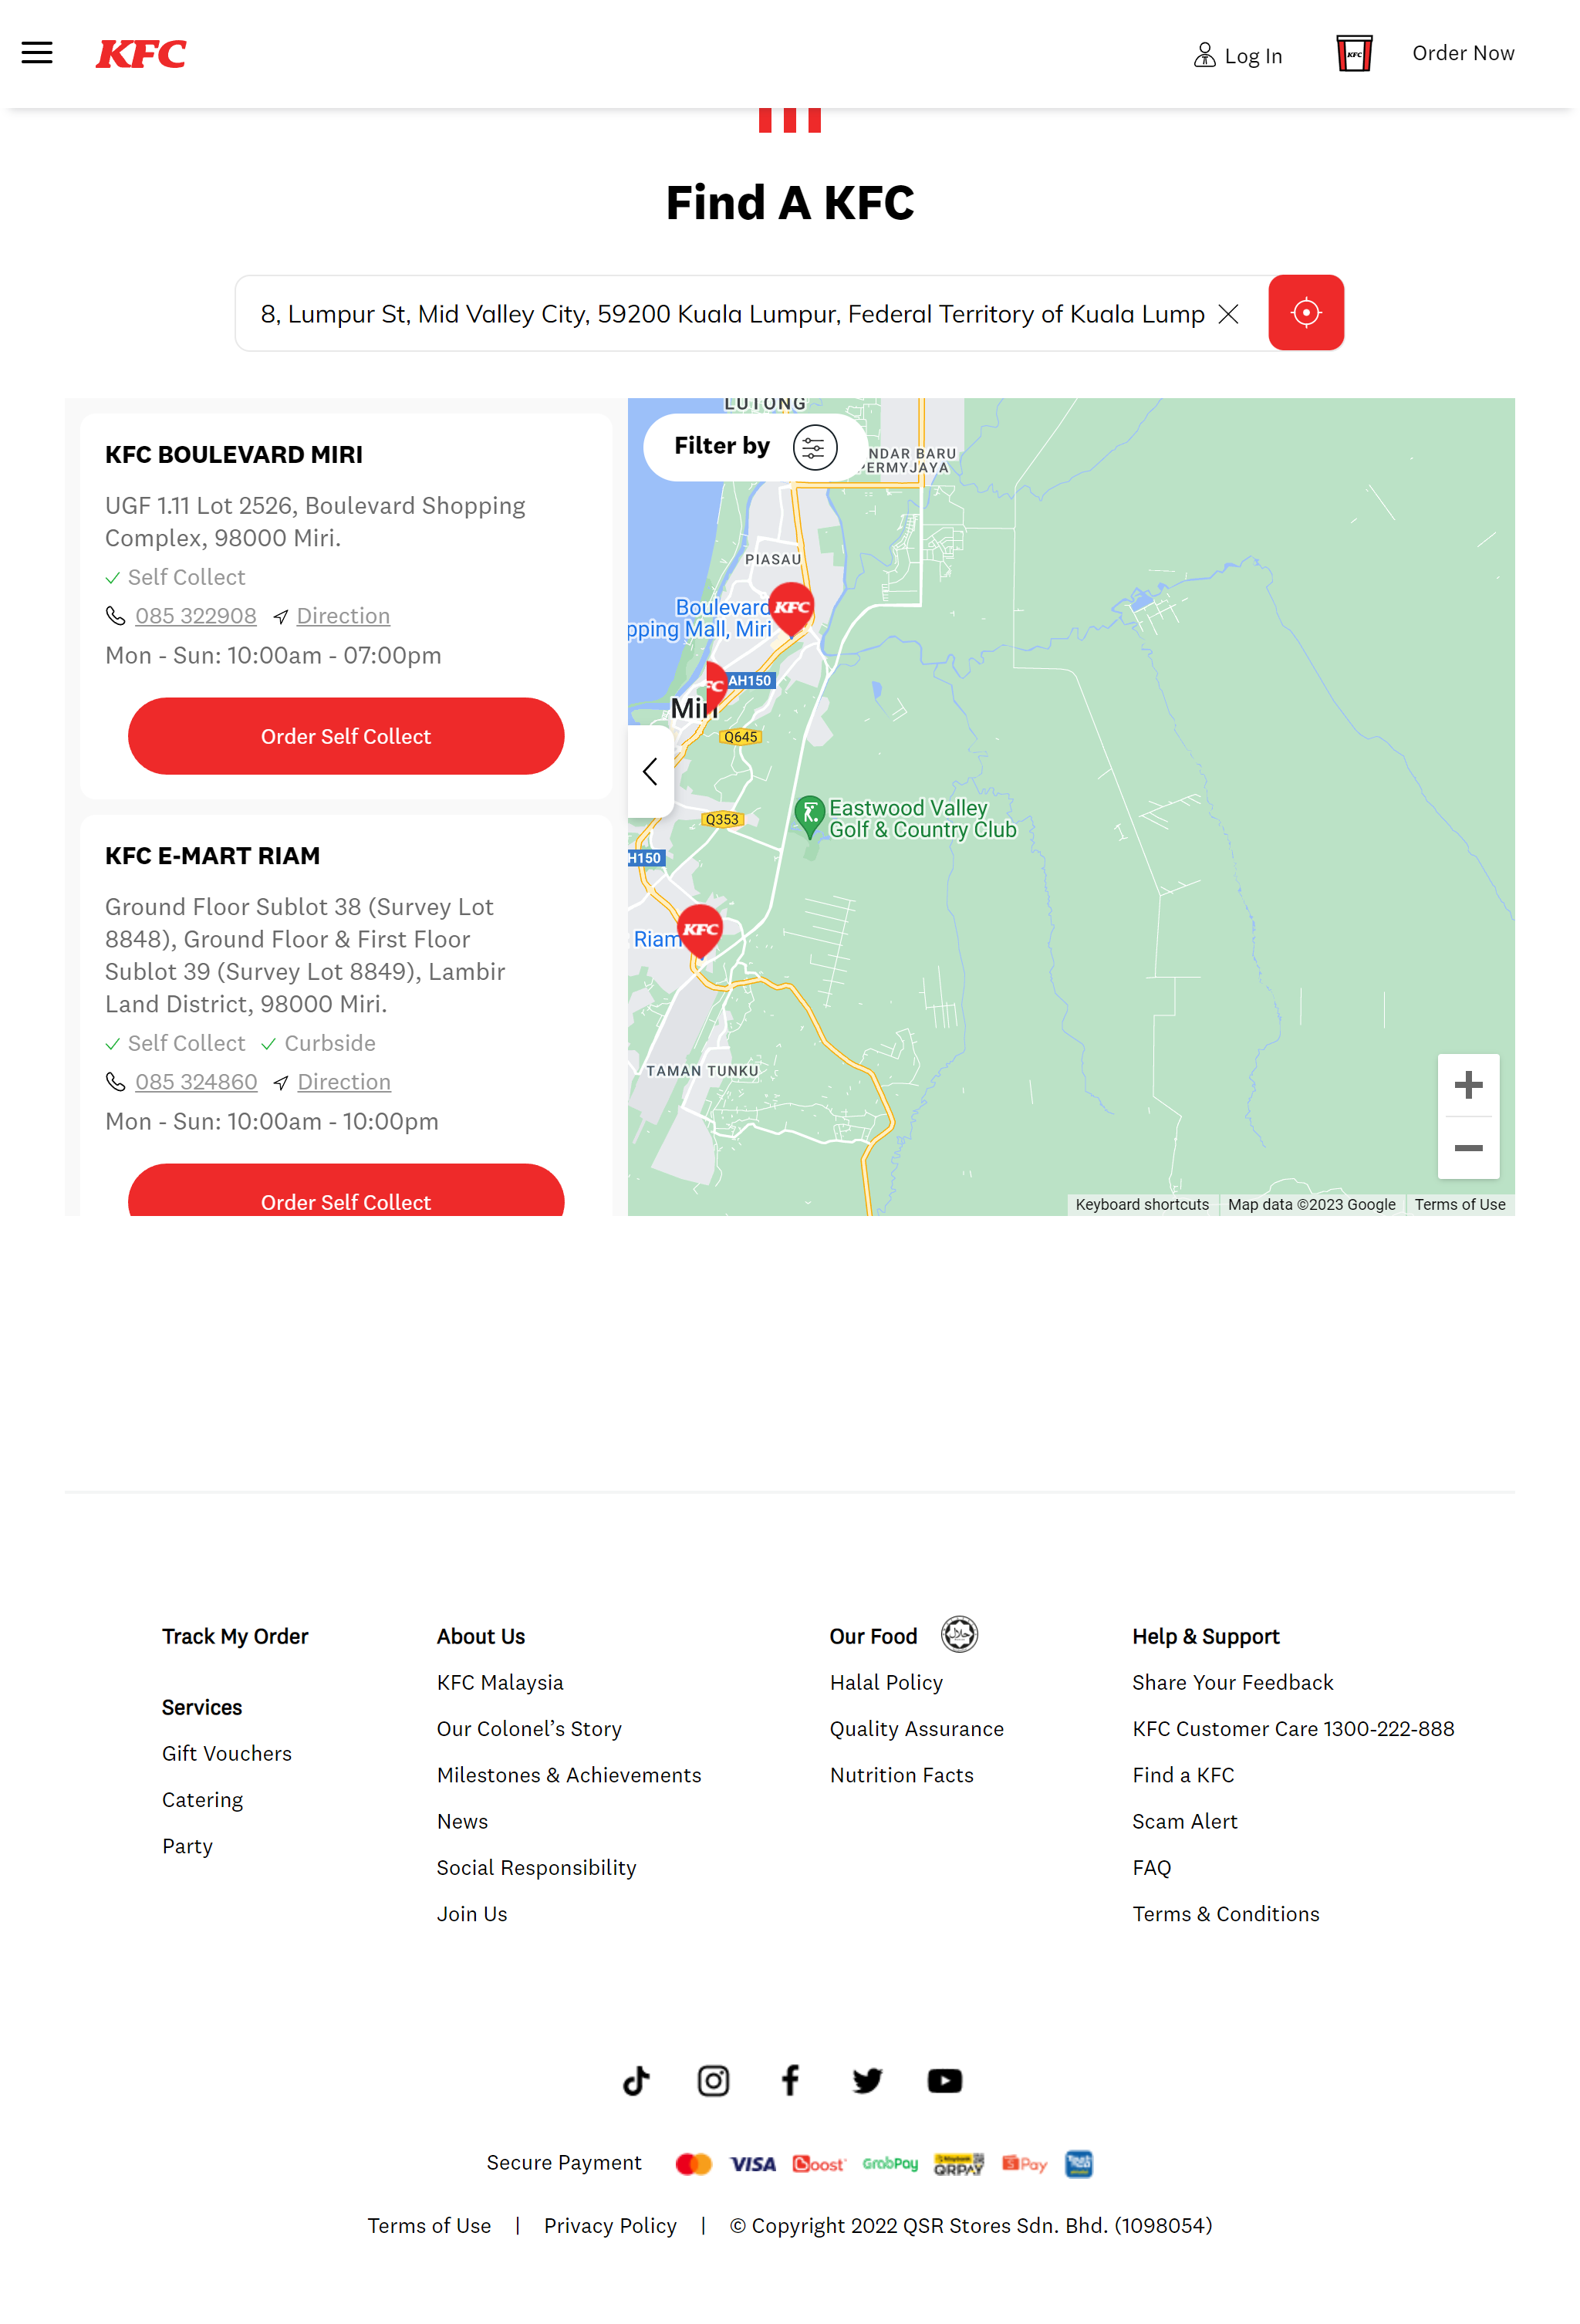
This webpage has to pull the outlet location data from a backend somewhere. We can sniff out the API using Chrome DevTools. Hit F12, navigate to the Network tab and refresh the page. Filter the outputs by Fetch/XHR.
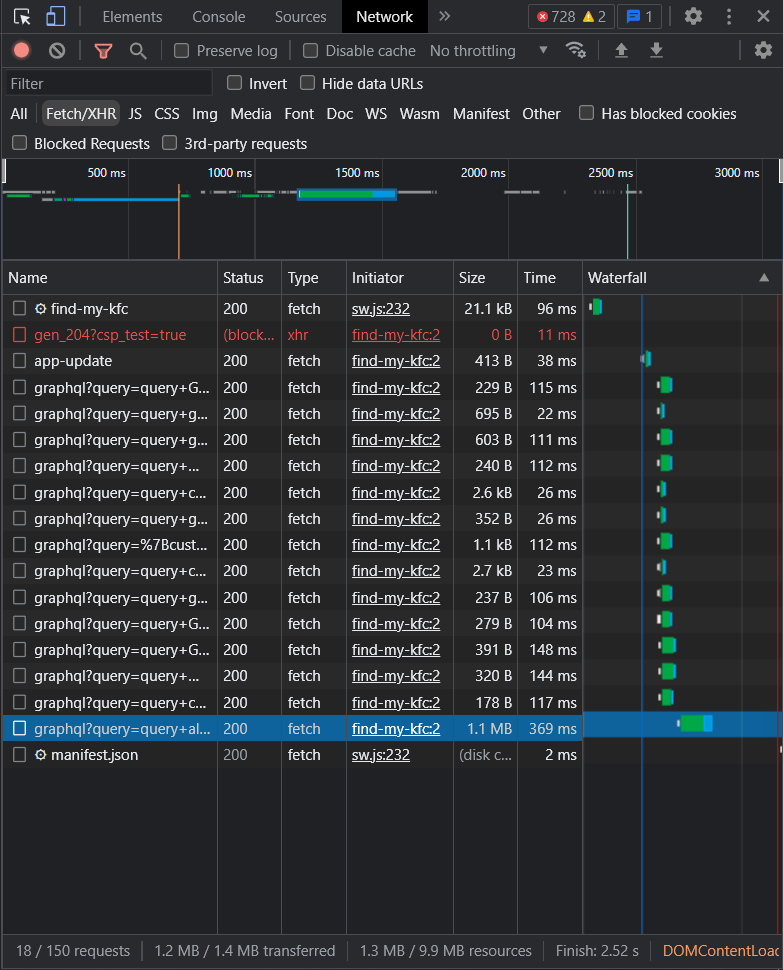
Looks like KFC uses a GraphQL backend. Now we need to identify the correct query that was made for the outlet locations. Intuitively it should be the one with the largest payload. Verify by checking its contents.
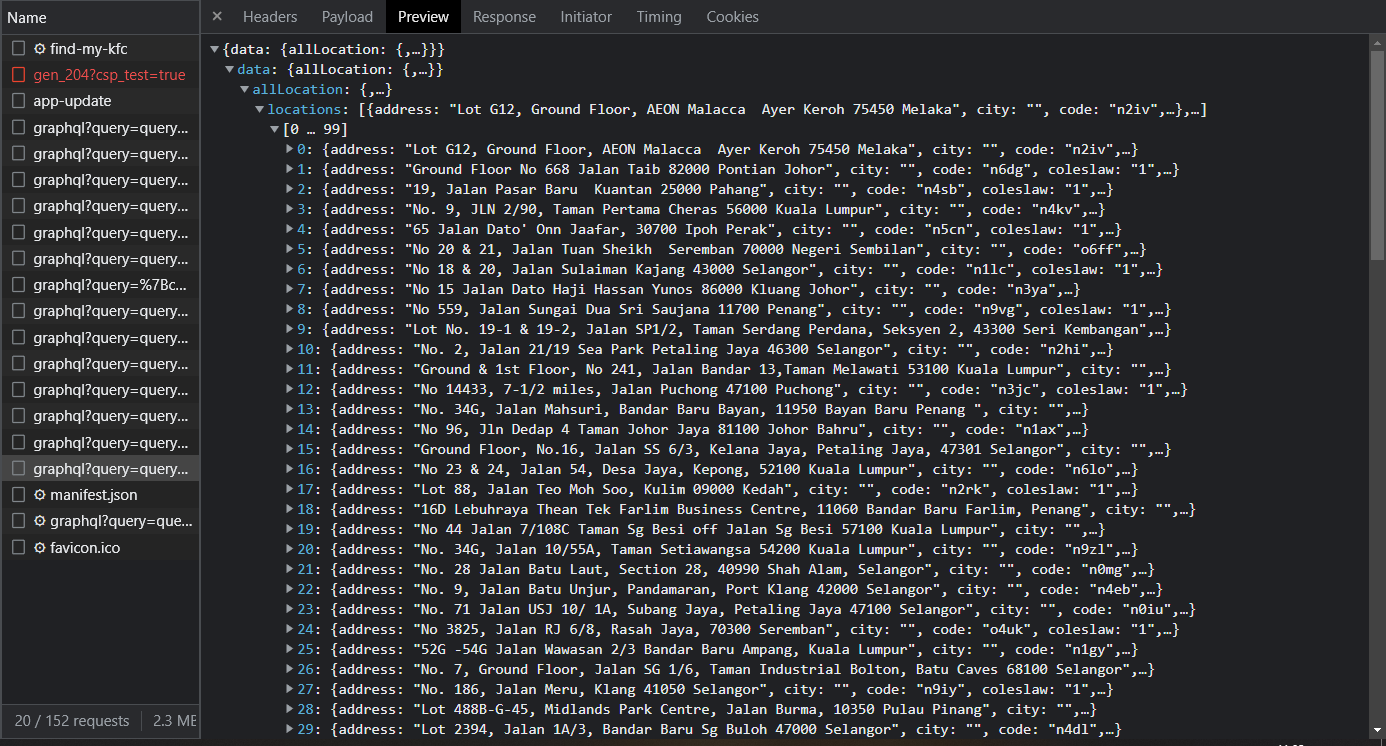
Great! It contains all the information we need including address, city, latitude, longitude and other metadata, and we didn’t need
to parse any HTML with tools like BeautifulSoup.
From here, simply copy the URL of the request. We are now ready to get this data from the URL and save it into a dataframe.
import requests
import pandas as pd

KFC = "<INPUT THE URL YOU COPIED HERE>"

def get_kfc(URL: str = KFC) -> pd.DataFrame:
    r = requests.get(URL)
    data = r.json()["data"]["allLocation"]["locations"]
    return pd.DataFrame(data)
McD, Pizza Hut, Dominos
Note that some of the API’s require the user to specify
- request parameters (ie: limit, region, etc)
- request headers
Most of these can also be copied from the DevTools page.
Consider the following code to extract locations from Pizza Hut.
def get_pizza_hut(URL: str = PIZZA_HUT) -> pd.DataFrame:

    headers = {
        "accept": "application/json, text/plain, */*",
        "accept-language": "en-US,en;q=0.9",
        "client": "236e3ed4-3038-441a-be5b-417871eb84d4",
        "lang": "en",
        "sec-ch-ua": ""Not?A_Brand";v="8", "Chromium";v="108", "Google Chrome";v="108"",
        "sec-ch-ua-mobile": "?0",
        "sec-ch-ua-platform": ""Windows"",
        "sec-fetch-dest": "empty",
        "sec-fetch-mode": "cors",
        "sec-fetch-site": "cross-site",
        "Referer": "https://www.pizzahut.com.my/",
        "Referrer-Policy": "strict-origin-when-cross-origin"
    }

    payload = {
    "limit": 100000000000
    }

    r = requests.get(URL, headers=headers, params=payload).json()

    return pd.DataFrame(r["data"]["items"])
We set the limit parameter to a large number so all outlets are included in the response.
Headers are set exactly like how a Chrome web browser makes the request to validate our identity.
Plotting the Data
Requirements:
geopandasmatplotlibshapely
We will need two sets of data:
- Geographical boundaries of Malaysia
- Latitude and longitudes of the outlets
The prior can be accessed as a .geojson file from the Department of Statistics, Malaysia.
The latter is included in the data we scraped earlier.
Data Preperation
We simply read in the geodata using geopandas.
STATE_URL = "https://raw.githubusercontent.com/dosm-malaysia/data-open/main/datasets/geodata/administrative_1_state.geojson"
state_geo = gpd.read_file(STATE_URL)
Use the function we created earlier to get lat & long of the outlets.
kfc = get_kfc()[['address', 'gesStoreId','lat', 'locationId','long', 'name', 'state']]Now we need to create POINT objects from the coordinates and save it as a GeoDataFrame
kfc_geo = gpd.GeoDataFrame(kfc, geometry=gpd.points_from_xy(kfc.long, kfc.lat))Plotting
fig, ax = plt.subplots()
ax.axis('off')

# Layer 1 : plot geographic boundaries
state_geo.plot(ax=ax, edgecolor="black", linewidth=1, color="white")

# Layer 2 : outlet locations as scatter
# Set the alpha low so we can differentiate denser areas
kfc_geo.plot(ax=ax, color="red", alpha=0.4)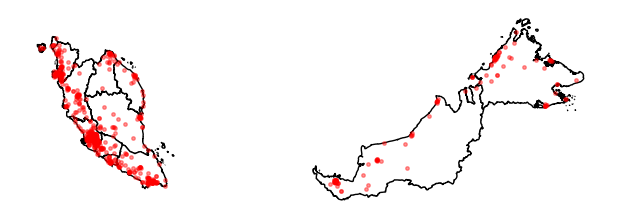
For the complete code, check out the notebook on GitHub
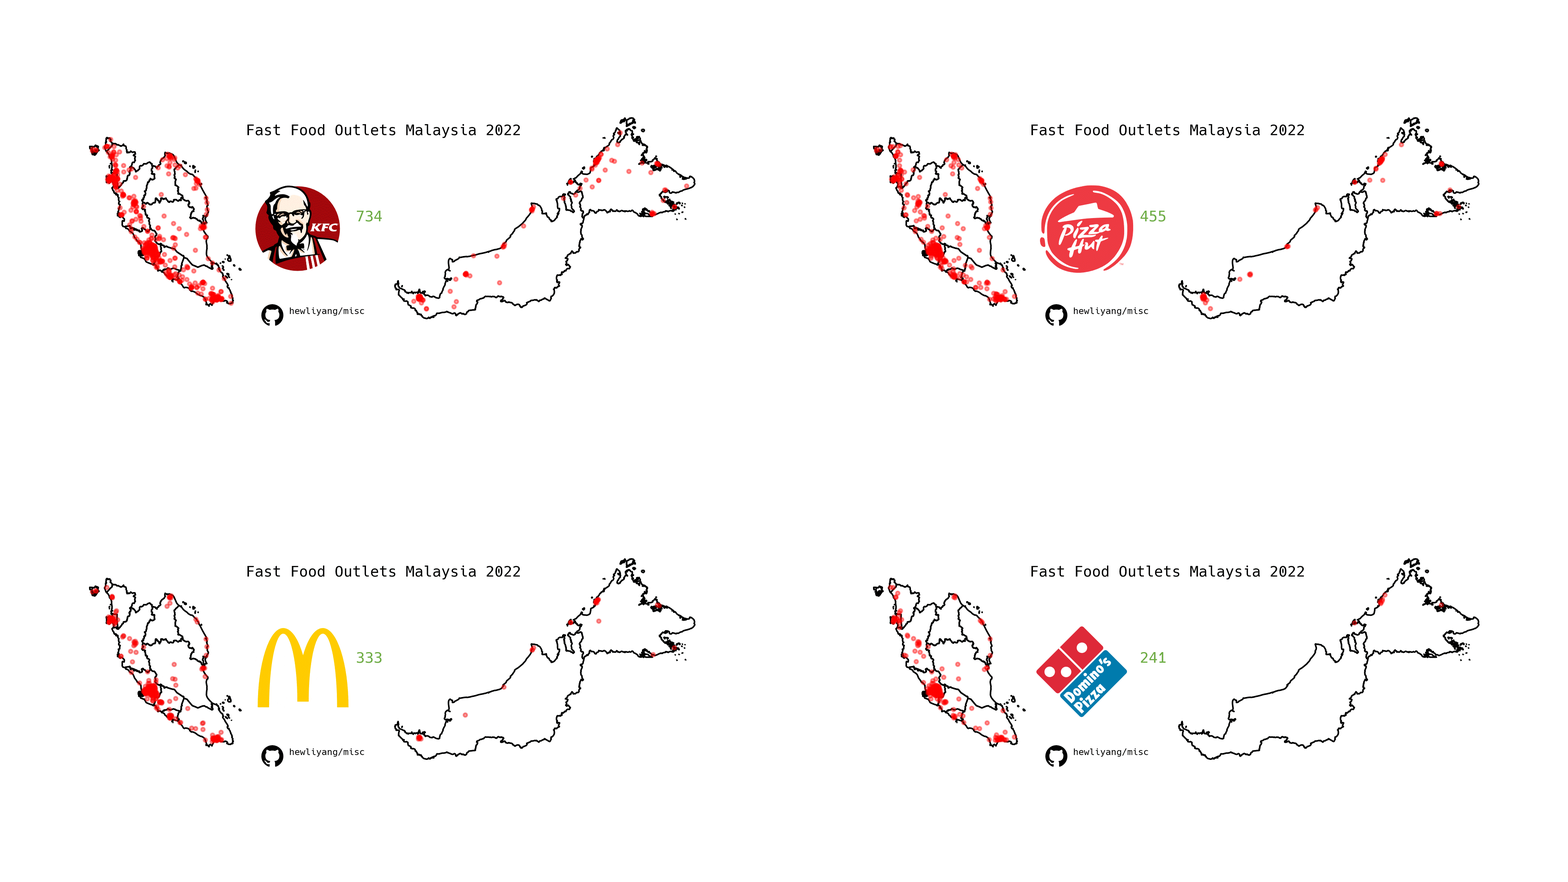
Repeating the same for all other outlets and export it to the image tool of your choice to come up with a neat infographic.
For the GIF below, I used good old Microsoft PowerPoint after exporting the matplotlib images from the notebook.
I’m sure this would have been possible to do purely in Python as well, perhaps with opencv and ffmpeg, but it didn’t seem worth the
effort for me.
Conclusion
You will find yourself saving lots of time while scraping data by checking fetch requests in your browser first. Only if you are not able to:
- Find the correct API
- The content you are looking for is statically rendered
should you resort to using things like a headless browser like selenium & HTML parsers like beautifulsoup.
Statically rendered content refers to data that is already embedded within the HTML of a page before it leaves the server and reaches your browser
We didn’t see it in this scenario, but some API’s are paginated. This means that only a limited amount of data is loaded at one time, for example outlet , then and so on in order to minimize loading times on user devices as well as reducing load on servers.
You may find that the size of these pages are limited to a certain number, say for similar reasons. In this case, you would need to write a run a loop to programatically walk from page to page , assuming the total number of items is . Then, we also know that the total number of requests made would be